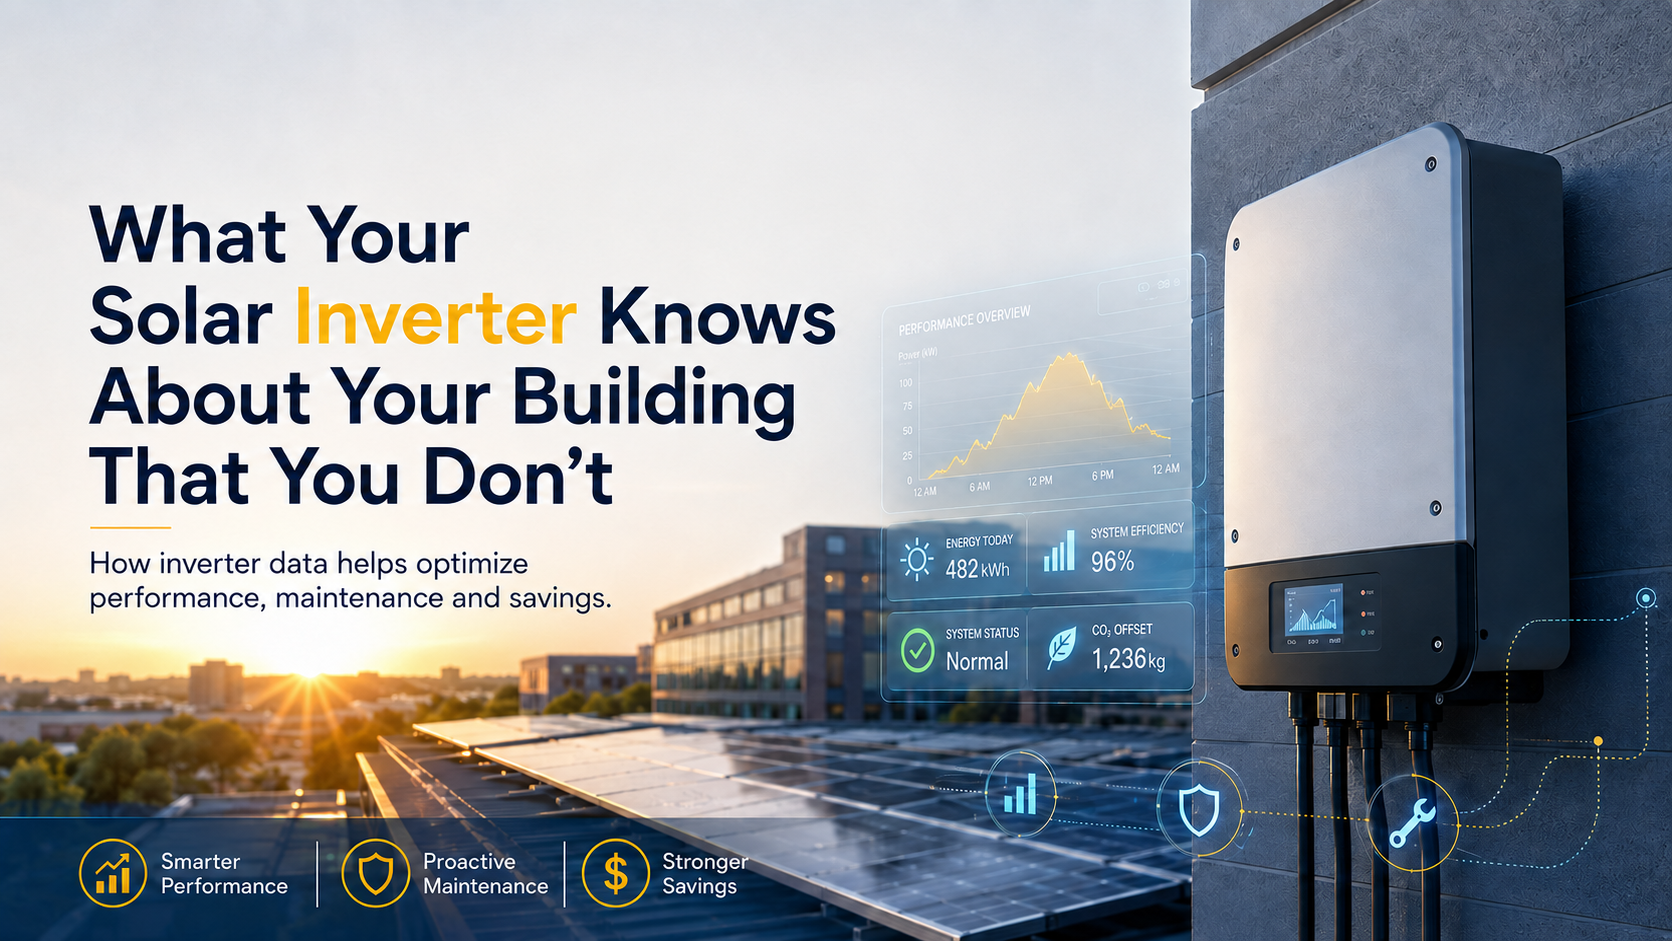
Solar panels are the most visible part of a rooftop solar system. They sit under the sun, generate electricity and usually receive most of the attention.
But the component quietly collecting some of the most useful information about your solar plant is often mounted on a wall or inside an electrical room.
The solar inverter.
Most building owners think of an inverter simply as the equipment that converts the DC electricity produced by solar panels into AC electricity that can be used by the building.
That is correct—but it is only part of the story.
Modern solar inverters and their monitoring platforms can continuously record generation patterns, operating conditions, faults and other system data. When the system also includes suitable energy meters or monitoring equipment, the data can provide an even clearer picture of how the building produces, consumes and exchanges electricity.
In other words, your solar system may be telling you much more than just:
“Today we generated 200 units.”
The real question is:
Are you actually looking at what the data is trying to tell you?
Your Inverter Is the Communication Centre of the Solar Plant
Every solar panel produces DC electricity.
Before that electricity can be used by your office, factory, commercial building or home, it must be converted into AC electricity.
That is the inverter's primary job.
But while performing this conversion, modern inverters can also monitor several operating parameters depending on the model and monitoring configuration, including:
Solar generation
DC voltage and current
AC voltage
Grid frequency
Inverter operating status
Daily and monthly energy production
Fault and warning notifications
String-level information on supported systems
Historical generation trends
Some installations also integrate energy meters, current transformers, data loggers or energy-management systems.
With those additional devices, owners can compare solar generation with actual building consumption and grid import/export.
This is where ordinary solar monitoring starts becoming valuable business intelligence.
1. It Knows When Your Solar Plant Is Performing at Its Best
A properly monitored solar system develops a recognizable generation pattern.
Generation normally starts increasing after sunrise, rises toward the middle of the day and gradually decreases toward sunset.
However, the exact curve changes depending on:
Weather
Season
Panel orientation
Temperature
Shading
System design
Local site conditions
Over time, monitoring data establishes a performance history for the plant.
Imagine that your system normally produces strong output between 10:30 AM and 2:00 PM.
One week, the monitoring platform begins showing noticeably lower production during the same period despite similar weather conditions.
Something may have changed.
It could be:
Dust accumulation
New shading
A string issue
An inverter warning
A disconnected cable
Maintenance-related downtime
Another technical problem
Without monitoring, the reduction might remain unnoticed for weeks or even months.
With monitoring, the abnormal behaviour can become visible much earlier.
2. It Can Show You That “Sunny” Does Not Always Mean “Maximum Generation”
One of the biggest misunderstandings in solar is that the hottest and brightest afternoon should automatically produce the highest output.
Solar panels need sunlight.
But solar modules are also affected by temperature.
As module temperature increases, their electrical efficiency generally decreases.
This means an extremely hot afternoon can sometimes produce less instantaneous power than a cooler period with excellent sunlight.
Your inverter sees the resulting electrical output.
So when you look at generation data across different days, you may notice something interesting:
A cooler, clear day can sometimes outperform a much hotter day.
That does not necessarily mean there is a problem with the system.
Understanding these patterns helps owners avoid judging system performance using sunlight alone.
Solar performance should always be evaluated using proper data, environmental conditions and expected system behaviour.
3. It May Reveal Problems Before Your Electricity Bill Does
Electricity bills are retrospective.
A bill tells you what happened during an entire billing period.
By the time a reduced solar contribution becomes obvious in your bill, the plant may already have been underperforming for several weeks.
Monitoring data is different.
It can provide daily—or sometimes much more frequent—information.
Suppose one section of the solar plant stops operating properly.
The overall system may still continue generating electricity.
There may be no dramatic shutdown.
No alarm visible to building occupants.
No obvious physical damage.
But your daily generation could quietly fall.
That is why monitoring is important.
A relatively small percentage loss repeated every day can become a meaningful amount of lost energy over months and years.
4. It Can Help Identify Unexpected Drops in Generation
Solar generation naturally changes.
Clouds pass over the building.
Rainy days reduce available sunlight.
Winter and summer have different solar conditions.
So every reduction is not a fault.
The important thing is identifying unexpected patterns.
For example:
Sudden Drop
If generation falls sharply and remains low, there may be an electrical, inverter or system issue.
Repeated Drop at the Same Time
If output falls every day at approximately the same hour, shading could be one possible cause.
A nearby building, tree, water tank or other rooftop structure might be affecting part of the array.
Gradual Performance Decline
If the plant slowly produces less than expected over time, the cause may require investigation.
Potential reasons can include:
Dirt accumulation
Environmental conditions
Component degradation
Technical faults
Changes around the installation
Monitoring does not automatically diagnose every problem.
But it gives technicians valuable information about where and when to investigate.
5. It Can Tell You Whether Cleaning Is Actually Making a Difference
Solar panel cleaning is important in locations where dust, pollution, bird droppings and other deposits accumulate.
But how do you know whether cleaning improved performance?
Instead of relying only on visual appearance, generation data can help.
Technicians can compare suitable periods before and after cleaning while also considering weather and sunlight conditions.
If heavily soiled modules were limiting production, improved output may become visible after cleaning.
This makes maintenance more measurable.
The discussion changes from:
“The panels look cleaner.”
to:
“The system is performing better after maintenance.”
That difference matters, particularly for commercial and industrial solar plants where every lost unit of generation can affect financial returns.
6. With the Right Metering, It Can Show How Your Building Uses Solar Power
This is one of the most valuable insights for businesses.
An inverter primarily measures solar-side information.
However, when the solar system is integrated with appropriate building energy meters or monitoring equipment, owners can understand something much bigger:
Solar Generation vs Building Consumption
Consider a commercial building whose solar plant produces maximum electricity during the afternoon.
If the building also consumes large amounts of electricity during those same hours, much of the solar energy may be consumed directly on-site.
But consider another building that operates mainly in the evening.
Its solar generation and electricity demand may not align as closely.
This demonstrates an important principle:
Two buildings with the same solar capacity can use solar energy very differently.
Understanding the building's load profile can help businesses improve the way they manage electricity.
7. It Can Help Identify Your Building's Energy Behaviour
When consumption monitoring is included, the solar dashboard can reveal patterns that many facility managers rarely notice.
For example:
What time does electricity demand start increasing?
When does the building reach peak demand?
Does consumption remain high during lunch hours?
Is significant power being used after working hours?
How much daytime demand is being met by solar?
How much electricity continues to come from the grid?
For commercial and industrial facilities, this information can be extremely useful.
The solar system stops being just a rooftop installation.
It becomes part of a broader energy-management strategy.
8. It Can Reveal Whether Your Solar Plant and Your Business Schedule Match
Imagine two companies.
Company A
Operating hours: 8:00 AM – 6:00 PM
Most electricity consumption happens during daylight hours.
Company B
Operating hours: 4:00 PM – Midnight
Both companies install the same solar capacity.
Will they receive exactly the same benefit?
Not necessarily.
The plant may generate a similar amount of solar electricity, but when the electricity is consumed matters.
Company A may directly use more of its solar generation during business operations.
Company B may have a different import/export profile depending on its system, tariff structure and local regulations.
Monitoring helps businesses understand this relationship.
And once you understand the relationship, you can make better energy decisions.
9. It Creates a Performance History of Your Solar Investment
A solar plant is designed to operate for decades.
That makes long-term data extremely valuable.
Imagine being able to compare:
Year 1 → Year 3 → Year 5 → Year 10
You can study:
Annual generation
Seasonal behaviour
Maintenance history
Fault events
System downtime
Changes in production patterns
This historical data helps owners understand whether their solar plant is behaving as expected.
It can also support maintenance teams when investigating unusual changes.
Without proper monitoring, many owners rely on memory:
“I think the plant generated more electricity last year.”
Data provides a better answer.
10. It Can Make Solar Maintenance More Proactive
Traditional maintenance often begins after somebody notices a problem.
The inverter stops.
A breaker trips.
The electricity bill rises.
Or someone realizes generation is lower than expected.
Data-driven maintenance works differently.
Monitoring allows owners and service teams to identify unusual behaviour earlier and investigate before a minor problem develops into a larger one.
This does not mean remote monitoring replaces physical inspection.
A complete solar maintenance strategy can still include:
Module inspection
Panel cleaning
Cable inspection
Connector inspection
Earthing checks
Inverter inspection
Structure inspection
Thermal inspection where appropriate
Electrical testing
Performance analysis
Monitoring simply adds another layer.
The physical inspection tells you what the equipment looks like.
The data tells you how the equipment has been behaving.
Together, they provide a much stronger picture of plant health.
A Solar Plant Can Be Generating Electricity and Still Be Underperforming
One of the most important lessons for any solar owner is this:
“Working” and “performing optimally” are not the same thing.
An inverter showing a green operating light does not automatically mean every part of the solar plant is delivering its expected performance.
The system may still generate electricity while experiencing:
Partial shading
Module soiling
String imbalance
Temporary faults
Electrical losses
Maintenance issues
Component-level performance problems
That is why professional solar operation should include more than simply checking whether the inverter is ON.
It should include performance monitoring.
Don't Just Check How Much Solar You Generated
When opening your solar monitoring application, most people immediately look at one number:
Today's Generation
That number is useful.
But try looking deeper.
Compare:
Today vs yesterday
This month vs the same month last year
Expected generation vs actual generation
Morning performance vs afternoon performance
Solar generation vs building consumption
Generation before maintenance vs after maintenance
Patterns are often more valuable than individual numbers.
A single day tells you what happened.
A pattern tells you what may be changing.
Your Solar Plant Is Producing Two Things
Every day, your rooftop solar plant produces something obvious:
Electricity.
But it also produces something that is frequently ignored:
Data.
Electricity reduces your dependence on grid power.
Data helps you understand whether your solar investment is performing the way it should.
For homeowners, that can mean greater confidence in the system.
For commercial and industrial facilities, it can mean better performance management, faster fault identification and more informed energy decisions.
The panels may be sitting silently on your roof.
But through the inverter and monitoring system, your solar plant has a lot to say.
The smartest solar owners are the ones who listen.
Is Your Solar Plant Telling You Something?
If your solar generation has changed unexpectedly, your system is showing repeated performance drops, or you simply want to understand whether your plant is operating effectively, a professional system assessment can help identify what the numbers mean.
Daystar Solar provides solar system inspection, performance monitoring and maintenance support to help customers get more from their solar investment.
Don't just install solar. Understand how it performs.
Daystar Solar